Remote sensing · GIS · wildfire analysis
Kalimantan Wildfire Mapping & Analysis
An end-to-end remote sensing workflow, from multi-sensor hotspot data to cartographic visualization, historical comparison, and satellite-based burn validation.
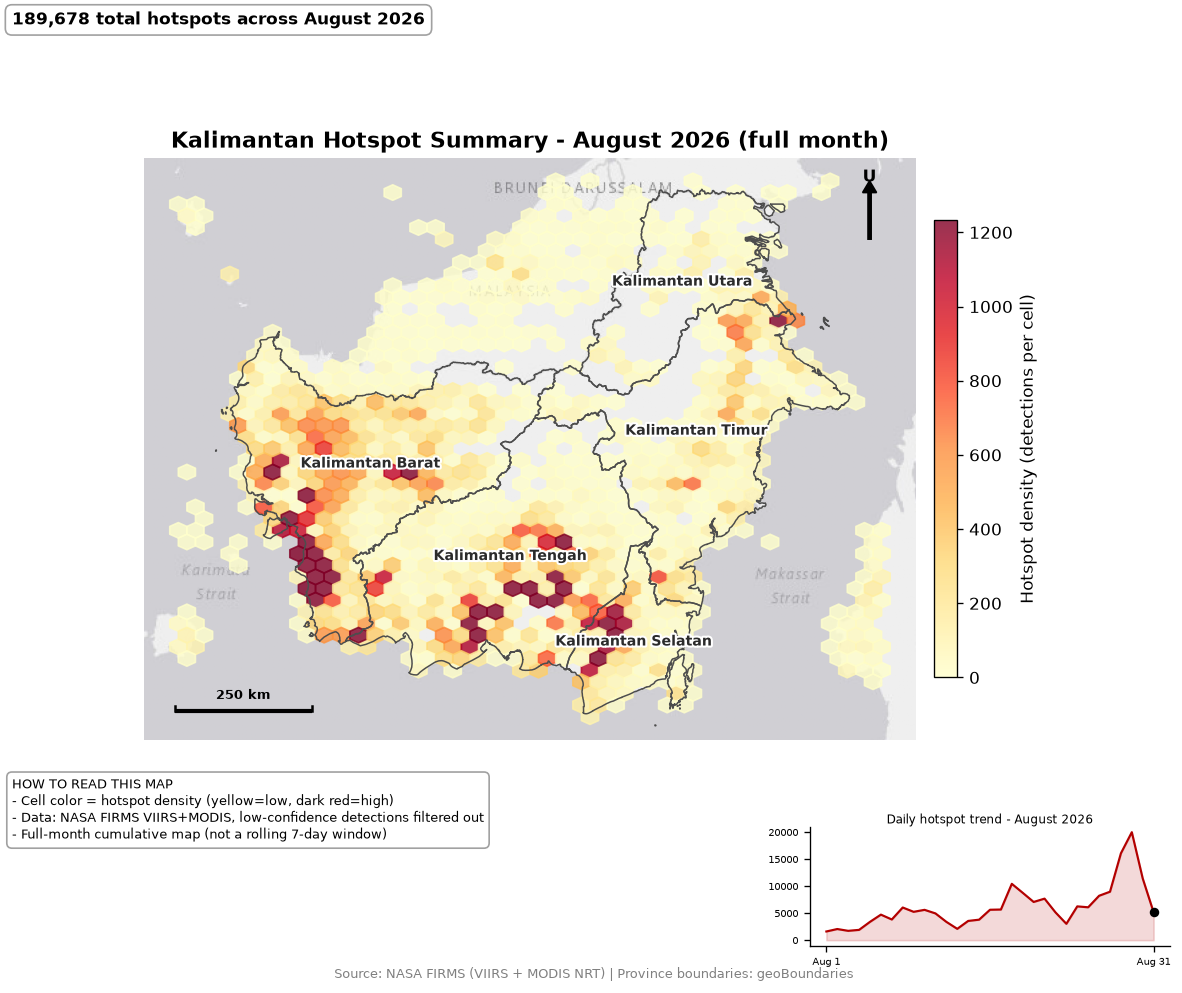
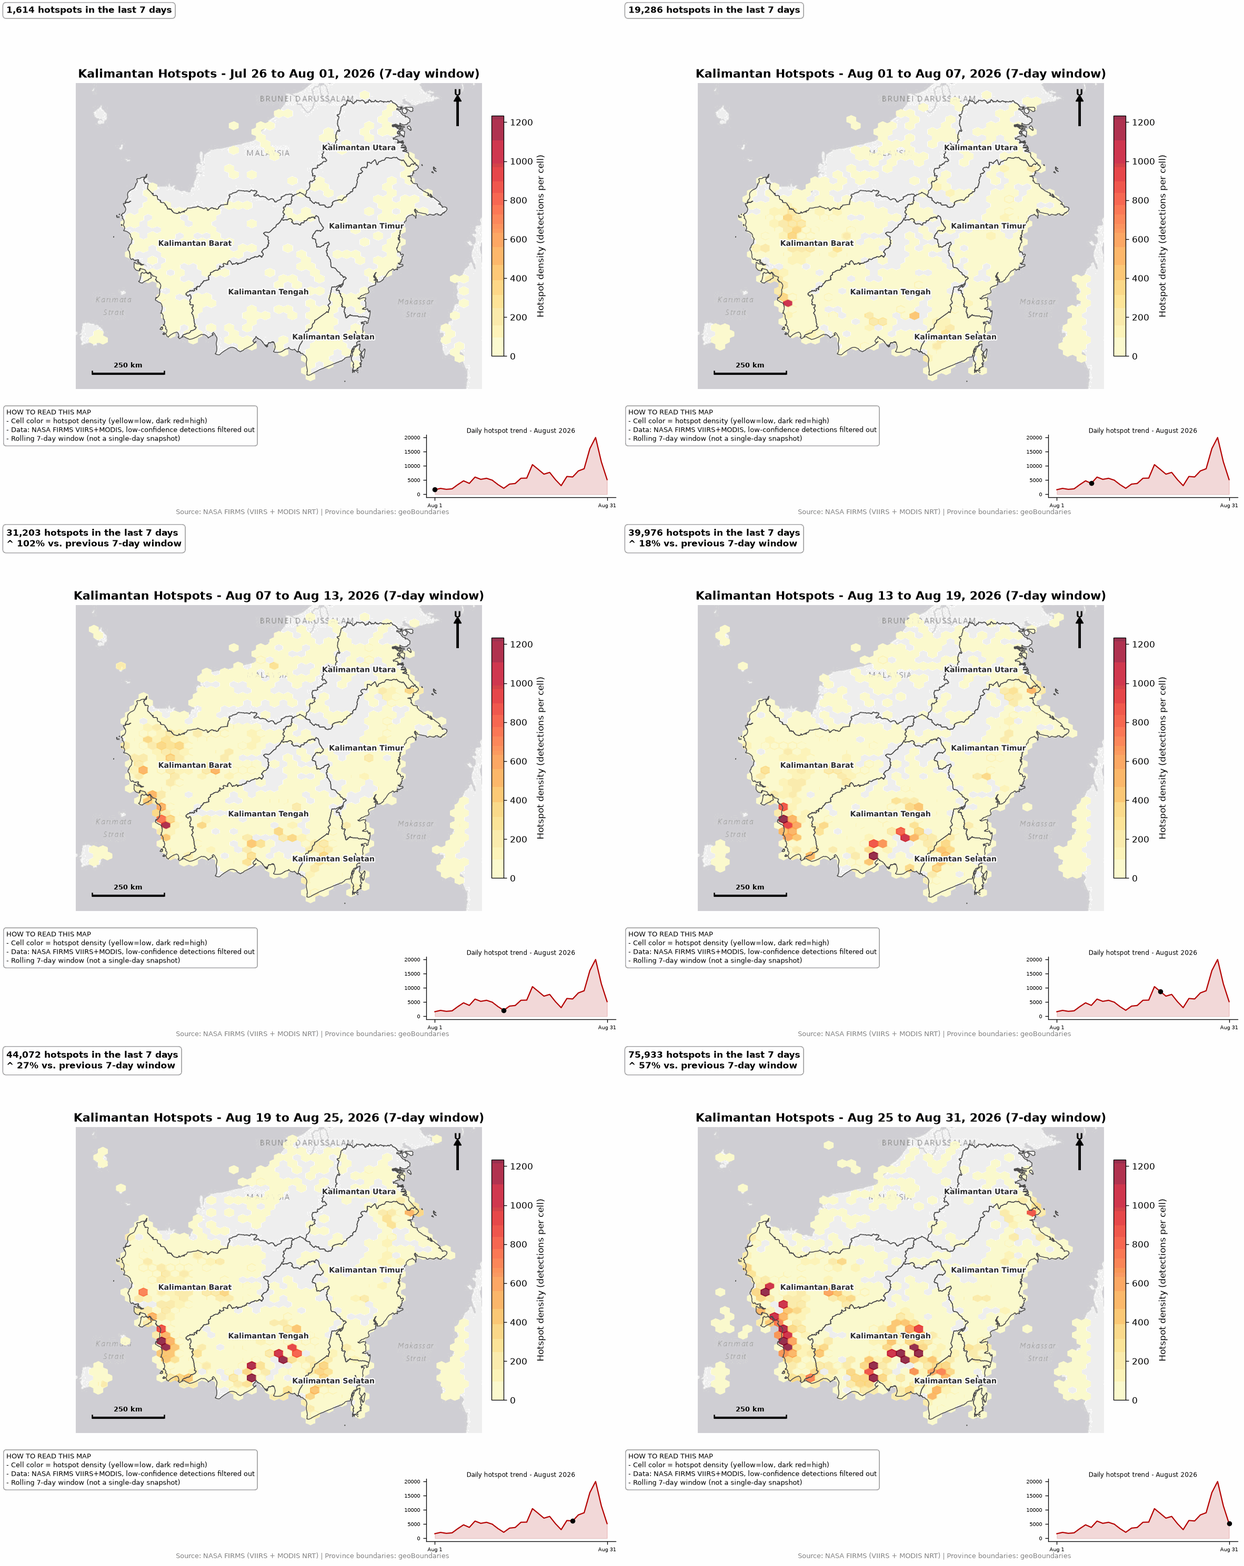
Hotspot timelapse
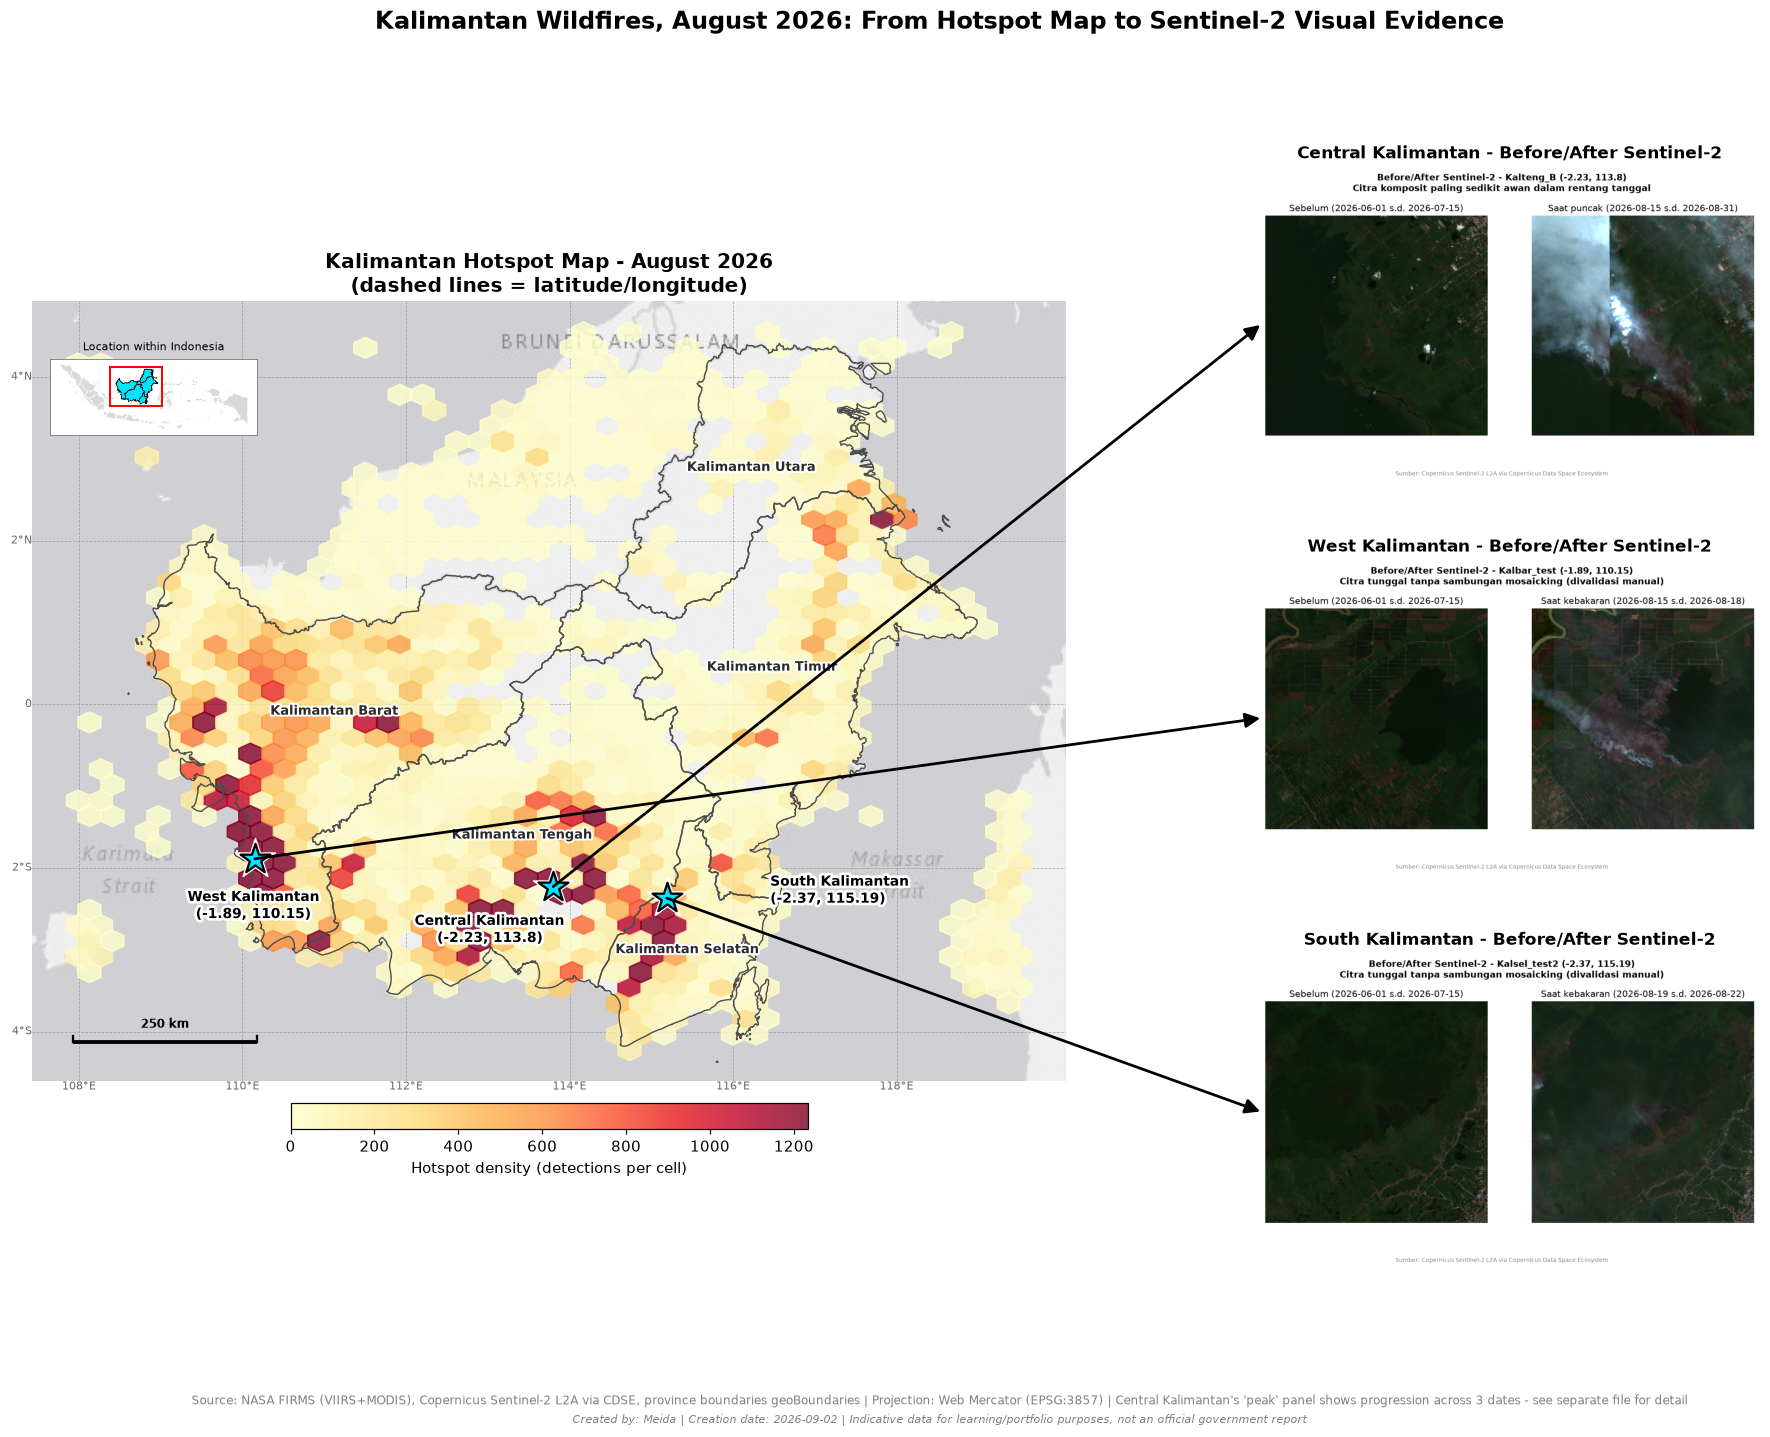
NASA FIRMS VIIRS and MODIS detections were filtered by confidence and cross-validated using spatial buffer analysis rather than coordinate rounding. The seven-day rolling visualization follows the visual logic used in emergency mapping products.
- Confidence filtering and cross-sensor deduplication
- Province boundaries, north arrow, scale bar, and legend
- ColorBrewer YlOrRd scheme for clear intensity communication
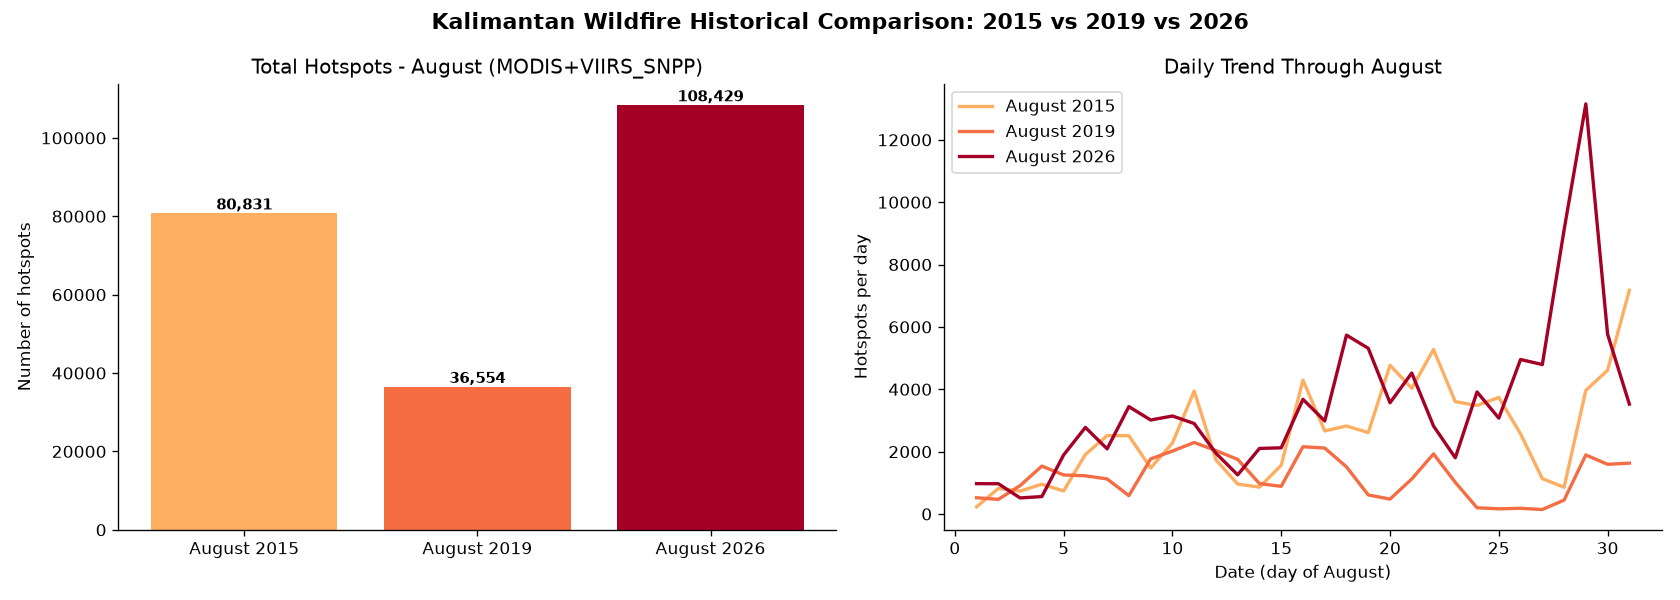
Historical comparison
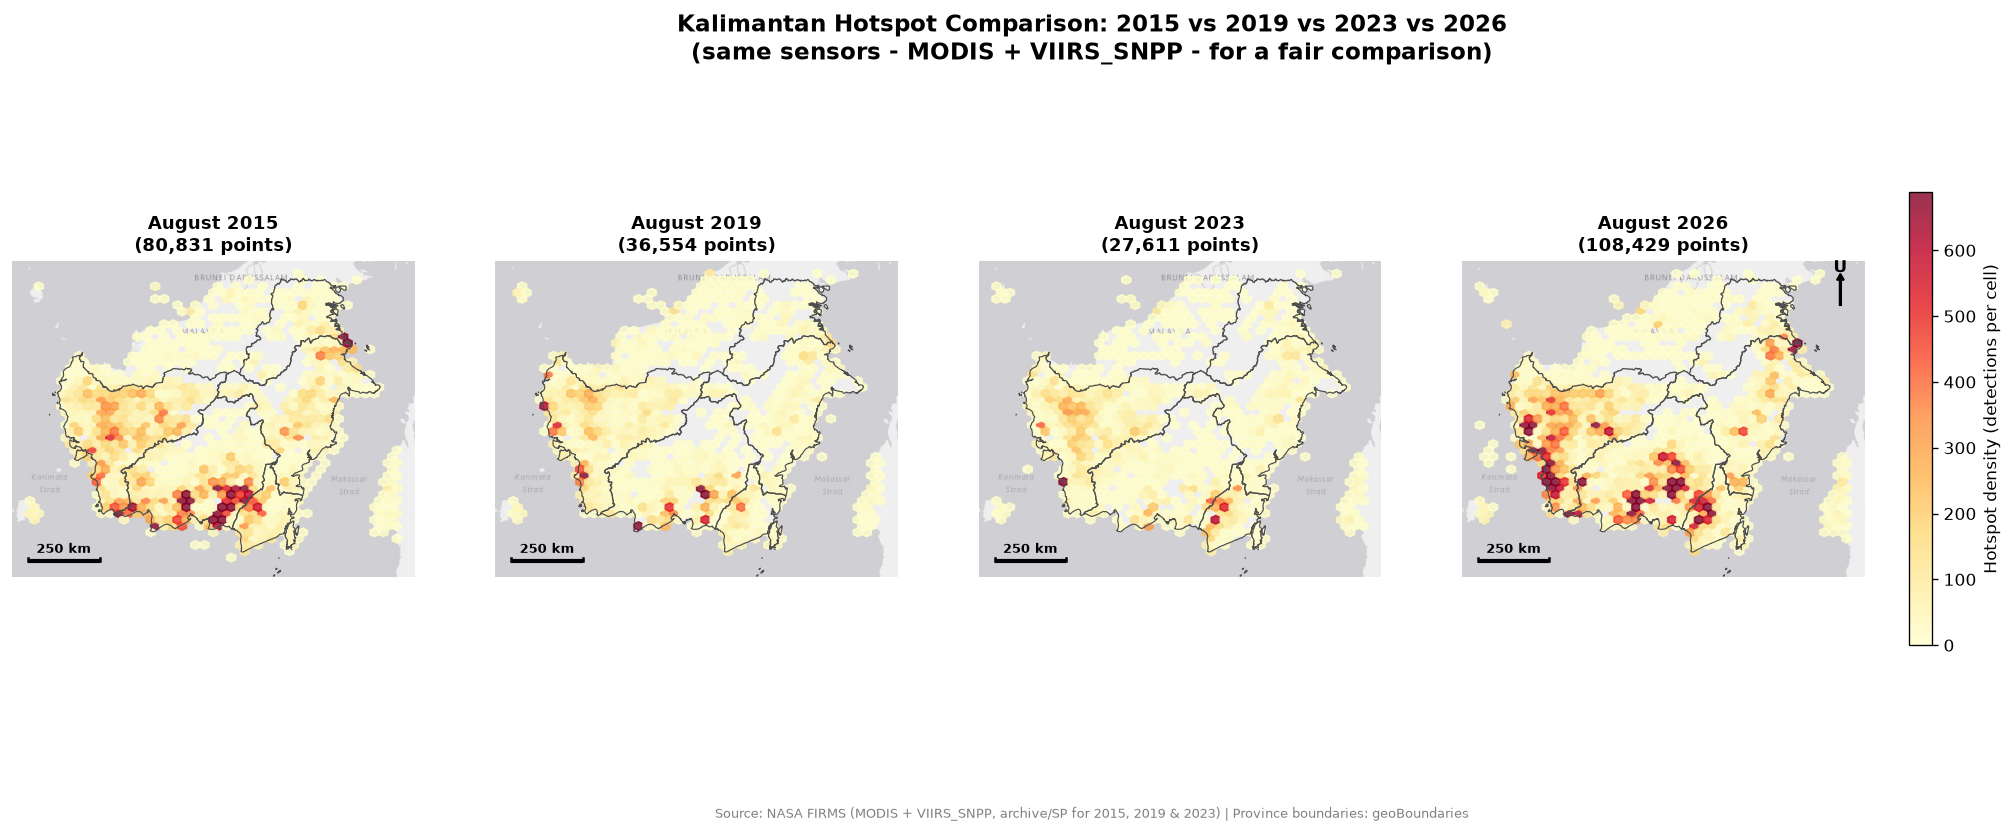
The same matched MODIS and VIIRS-SNPP sensor combination was used to compare August 2015, 2019, 2023, and 2026 fairly. The comparison shows that spatial clustering is not random: several hotspot zones recur across years.
- 2026 recorded the highest August total of the four periods
- Historical sensor availability was controlled to avoid false comparisons
- Recurring clusters were examined alongside peatland context
Recurring risk zones
Small-multiple maps make persistent geographic patterns easier to inspect. West Kalimantan's southwestern coastal belt and the Central–South Kalimantan border area repeatedly show dense activity, supporting further investigation into recurring peatland fire risk.
Visual validation with Sentinel-2 and dNBR
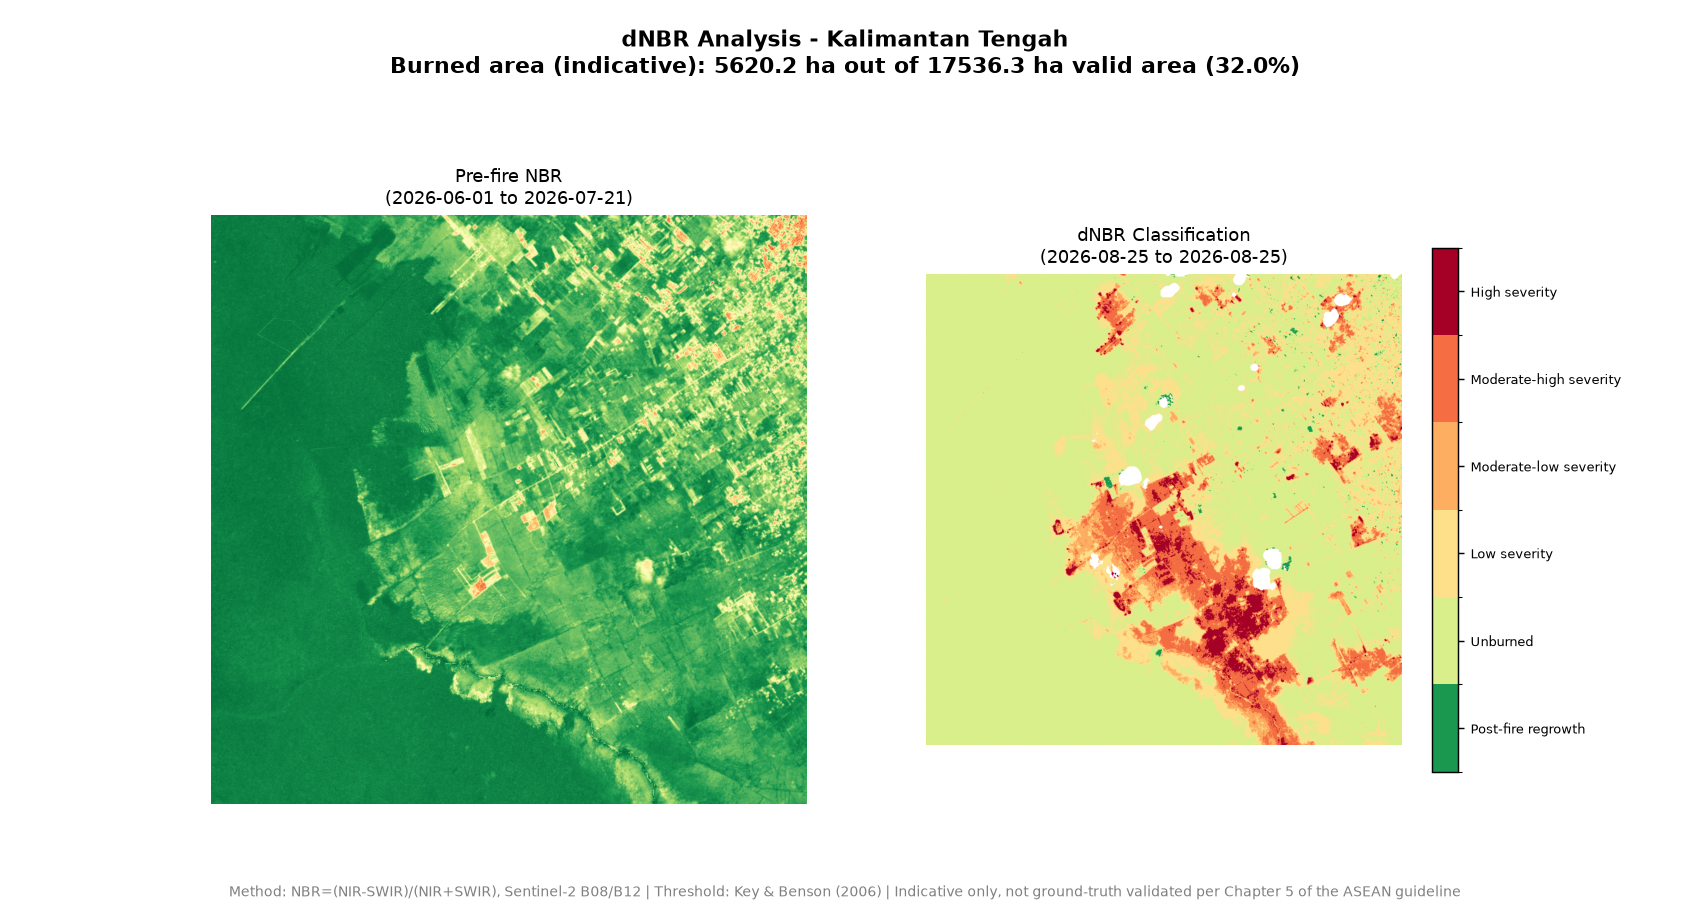
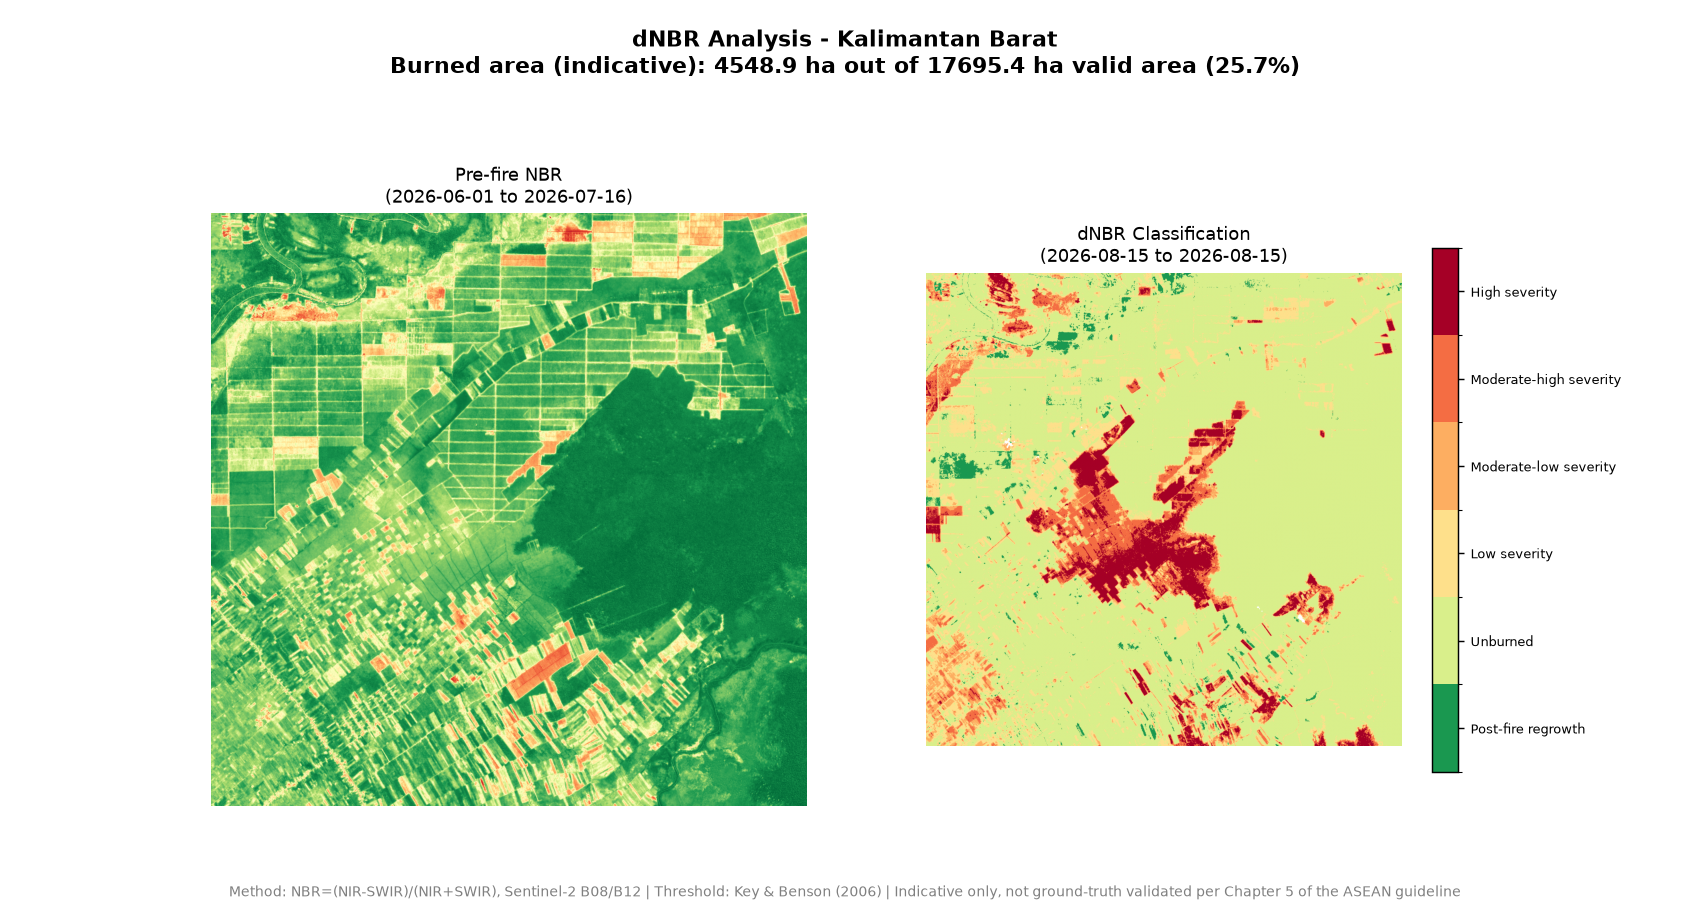
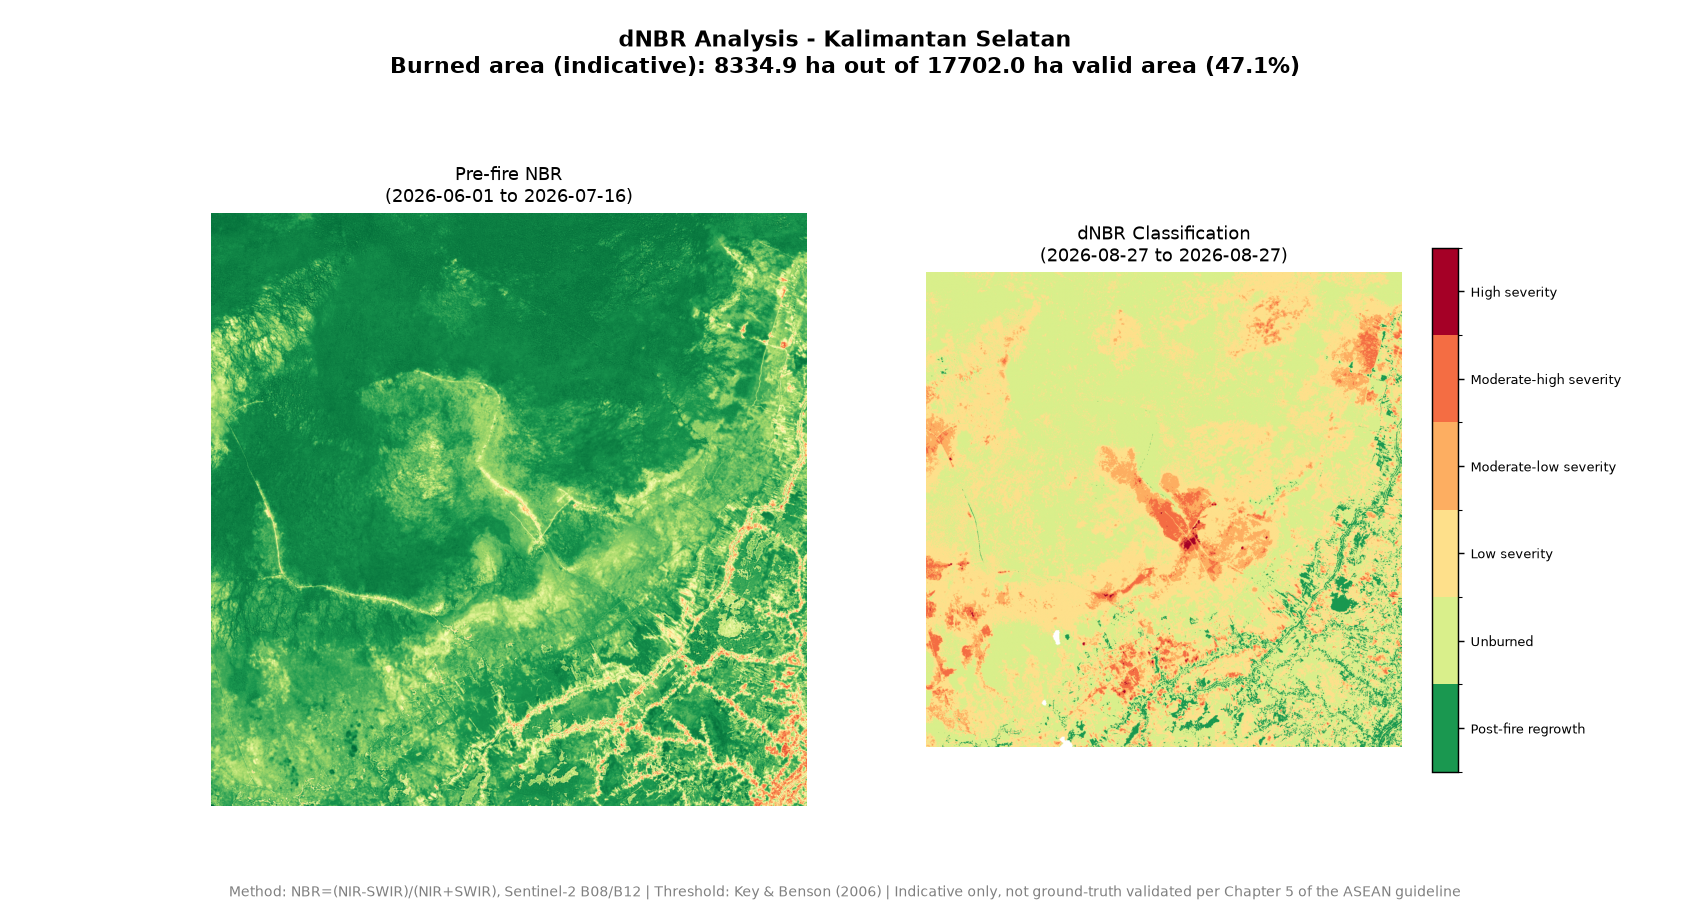
Hotspots alone can include false positives. Selected sites were inspected with 10 m Sentinel-2 imagery and assessed through dNBR (delta Normalized Burn Ratio), using NIR and SWIR bands to estimate vegetation-condition change before and after the event.
- NBR = (NIR − SWIR) / (NIR + SWIR)
- Severity classification and estimated burned area
- Validation distinguishes likely vegetation fire signals from visually similar non-fire surfaces
dNBR sample areas
Interpretation boundary. This analysis is indicative and produced for learning/portfolio purposes, not as an official government report. Sources include NASA FIRMS, Copernicus Sentinel-2, geoBoundaries, and NOAA CPC Oceanic Niño Index. dNBR findings have not been fully ground-truth validated.